First diagram
This tutorial shows the shortest path from an FCSTM model to a PlantUML diagram source file and rendered example. For export recipes, see Visualization tasks; for option facts, see Visualization options reference.
Example state machine
def int counter = 0;
def int error_count = 0;

state System {
    >> during before abstract GlobalMonitor;

    [*] -> Idle;
    !* -> Error :: FatalError;

    state Idle {
        enter {
            counter = 0;
        }
    }

    state Active {
        during before {
            counter = counter + 1;
        }

        state Processing {
            during {
                counter = counter + 10;
            }
        }

        state Waiting;

        [*] -> Processing;
        Processing -> Waiting :: Pause;
        Waiting -> Processing :: Resume;
    }

    state Error {
        enter {
            error_count = error_count + 1;
        }
    }

    Idle -> Active :: Start;
    Active -> Idle :: Stop effect {
        counter = 0;
    };
    Active -> Error : if [counter > 100];
    Error -> Idle : if [error_count < 3];
}
Generate PlantUML source
Use plantuml when you want deterministic text output:
#!/bin/bash
# Basic CLI visualization example

# Generate PlantUML with default settings
pyfcstm plantuml -i example.fcstm -o output_cli_basic.puml

echo "PlantUML diagram generated: output_cli_basic.puml"
Expected feedback:
PlantUML diagram generated: output_cli_basic.puml
Rendered example
The documentation resource build renders the generated PlantUML source into an SVG artifact:
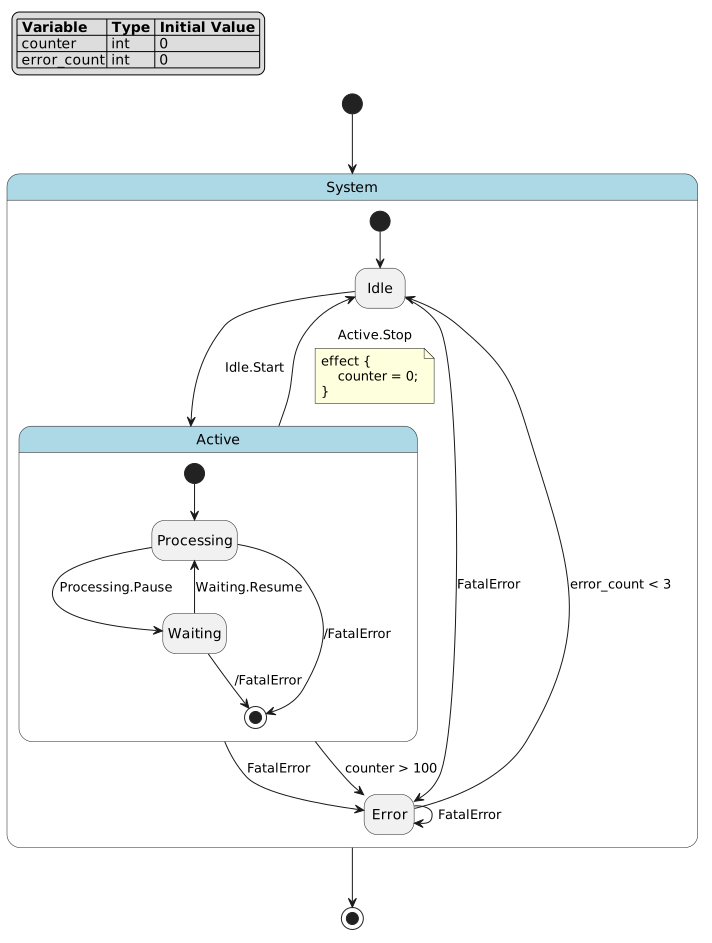
PlantUML diagram generated with CLI default settings.
Try detail presets
Use -l for the built-in detail presets:
pyfcstm plantuml -i example.fcstm -l minimal -o output_minimal.puml
pyfcstm plantuml -i example.fcstm -l normal -o output_normal.puml
pyfcstm plantuml -i example.fcstm -l full -o output_full.puml
The option reference explains which facts each preset affects.
Open the offline Python viewer
The Python Diagram facade is the browser-based path when you want a
self-contained HTML file with source/diagram comparison and browser-side SVG,
PNG, and vector PDF downloads. It does not require PlantUML or Node at runtime.
from pyfcstm.model import load_state_machine_from_text

model = load_state_machine_from_text("state Root { state Idle; [*] -> Idle; }")
diagram = model.diagram(direction="LR", cjk_locale="sc")
data = diagram.to_dict()
html = diagram.to_html()
output = diagram.show(open_window=False)
The first three values are, respectively, portable data, complete HTML text,
and a generated .html path. The HTML file contains the viewer, renderer,
WASM, and selected fonts, so it remains usable without a network connection.
Use open_window=True (the default) only when a Chromium-family browser is
available. It blocks until you close the window, the way
matplotlib.pyplot.show does, and then removes the temporary file it wrote —
pass a path to keep one. Without a browser, or on a machine with no display,
show raises DiagramUnavailableError; use open_window=False to create
the file without opening a window.
The synchronous to_svg(), to_png(), and to_pdf() methods are typed
capability probes in this stage and raise DiagramUnavailableError. The
browser export buttons in the generated HTML are the available three-format
export path; the optional headless Python runtime is owned by the later delivery
stage.
Where to go next
Visualization tasks shows PlantUML source export and direct rendered-file export tasks, plus the Python Diagram viewer workflow.
Visualization options reference lists
PlantUMLOptionsand CLI-cfacts and the Python Diagram option/value contracts.Quick Start includes visualization in the shortest end-to-end path.
Diagram viewer explanation explains why the viewer is one self-contained document, why
--openblocks, and who removes what.