Diagnostics explanation
Inspect diagnostics are designed to answer three questions:
What does the current model contain?
Which parts look invalid, risky, unused, unreachable, redundant, or target-sensitive?
What structured context should a human, CI job, IDE, or LLM repair loop use next?
This page explains the mechanism. It is not the field catalog; use Inspect report reference for report schemas and Diagnostics code reference for the complete code registry. Use Inspect tasks when you need a copyable command.
The inspect pipeline in one pass
pyfcstm inspect is a report pipeline wrapped around normal FCSTM loading.
A successful run has already passed the read, decode, parse, and model-building
boundary. Only then can inspect build the structural report and attach
diagnostics.
Stage |
What happens |
Successful output |
Failure boundary |
|---|---|---|---|
Read and decode |
The CLI reads bytes and decodes source text. |
Source text for excerpts. |
Missing file, permission error, or decode failure exits non-zero. |
Parse and build model |
The DSL parser and model importer resolve states, variables, events, imports, transitions, and lifecycle actions. |
|
Grammar or model-validation errors exit non-zero. |
Inspect structure |
|
|
Internal bugs should surface; they are not diagnostic entries. |
Static analyzers |
Analyzer modules add warnings and infos from structural, combo, numeric, data-flow, type-shape, redundancy, and design-health facts. |
Static |
Internal analyzer bugs surface as failures; lookup-only registry codes are not analyzer failures. |
Optional verify adapter |
With |
Additional verify-backed entries. |
Forbidden policies exit non-zero before a report is produced. |
Renderer |
The selected renderer emits human text, full JSON, |
stdout or output file. |
Write errors exit non-zero. |
The important design point is that diagnostics are report facts, not parser
errors. A syntax error does not become diagnostics[0]; it prevents the report
from existing.
What the static analyzers can see
Default inspect is static. It sees the model graph, authored and expanded transitions, resolved events, variables, lifecycle actions, action references, combo provenance, and lightweight expression facts. It does not execute the runtime and it does not ask an external event source what will happen in production.
Source family |
Examples of facts it can see |
Typical diagnostic shape |
|---|---|---|
|
Reachable states, leaf exits, initial targets, hierarchy shape. |
Missing entry, unreachable state, deadlock leaf, deep hierarchy. |
|
Authored combo trigger terms and generated relay provenance. |
Duplicate events, implied or contradictory guard prefixes, relay naming. |
|
Literal ranges, float-bitwise operations, constant division or shift risks for target profiles. |
Target-specific C/C++ deployment warnings. |
|
Reads, writes, guard-affect paths, abstract-action uncertainty. |
Unreferenced, unwritten-read, write-only, or never-changing variables. |
|
Ratios, large composites, aspect coverage, dead named actions. |
Maintainability warnings rather than semantic proof failures. |
|
Arithmetic-vs-boolean expression category facts. |
Type-shape errors or partial static warnings. |
|
Self assignments, unconditional transitions, redundant transition keys. |
No-op, redundant, or unconditional fall-through diagnostics. |
The analyzers attach span when they can point to a concrete source object
and attach refs when a consumer needs structured follow-up data. That is
why a good repair loop should branch on code and refs rather than scrape
English messages.
Figure-guided trace of the demo model
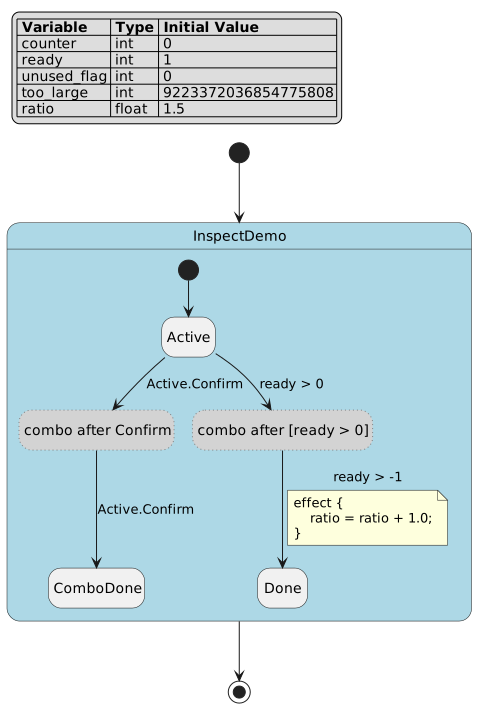
The diagram shows the expansion that source prose alone hides. Confirm +
Confirm and [ready > 0] + [ready > -1] become relay pseudo states. The
diagnostics still point back to the authored line and carry combo origin
references so a repair can edit the source trigger, not the generated relay.
Trace 1: repeated combo event
Authored source:
Active -> ComboDone :: Confirm + Confirm;
The model importer expands the combo trigger into two generated edges. That is
legal: a combo trigger is an ordered chain, so two terms produce two hops. The
static combo analyzer then compares resolved event identities and sees that term
0 and term 1 both resolve to InspectDemo.Active.Confirm.
The resulting diagnostic is W_COMBO_DUPLICATE_EVENT. Its span points at
the second Confirm term. Its refs include origin_id, term indexes,
term text, trigger span, transition span, and the span of the first matching
term. The human renderer uses the same span to print:
Active -> ComboDone :: Confirm + Confirm;
                                   ^^^^^^^
The recommendation is not “delete generated pseudo states.” The smallest source repair is to inspect whether the second term was meant to be another event, and only then reduce or replace the duplicated term.
Trace 2: target-specific numeric range
Authored source:
def int too_large = 9223372036854775808;
The literal is valid FCSTM source, and Python can represent that integer. The
numeric analyzer is not claiming the Python generated runtime overflows. It is
checking the C-family deployment profile used by default generated C and C++
templates, where the carrying type is PYFCSTM_GENERATED_INT64.
The diagnostic W_NUMERIC_LITERAL_OUT_OF_TARGET_RANGE therefore carries
refs.target_templates with c, c_poll, cpp, and cpp_poll. It
also carries the minimum and maximum range text and a runtime note. A CI gate
that deploys only the Python template may record this warning as irrelevant to
that target; a release gate that ships C or C++ output should treat it as a real
portability risk.
Trace 3: optional topological verify feedback
The tutorial model has leaf states with no outgoing edge. Default inspect
already reports W_DEADLOCK_LEAF from static structure. When the command adds
--enable-verify, the inspect adapter can also run closed structural topology
algorithms. The same model then reports facts such as W_TOPOLOGICAL_NOEXIT
and I_TOPOLOGICAL_NON_TERMINATING.
This does not mean inspect ran a state-space search. The adapter iterates
registry metadata and keeps only closed structural and SMT-local algorithms
within the selected complexity and call-count policy. Inspect does not parse
.fbmcq queries or load pyfcstm.bmc. The result is useful extra
model-derived feedback, not a proof over all event schedules and abstract
handlers.
Severity, risk, and emit tier
Severity answers how the current diagnostic should be prioritized. Emit tier answers where the diagnostic can come from. They are related but not the same.
Fact |
What it means |
What it does not mean |
|---|---|---|
|
The model cannot be safely constructed or used for the requested path. |
Every error appears inside a successful JSON report. |
|
The report is successful, but a structural, design, numeric, or verify fact needs review. |
The warning is automatically a release blocker for every target. |
|
A non-blocking observation may help explain intent or topology. |
The model is necessarily healthy or unhealthy. |
|
Default inspect can emit the code from static facts. |
The code was proven by an SMT solver. |
|
Optional verify integration may emit the code. |
It runs without |
|
Explicit resolver APIs own the code. |
It is expected in ordinary CLI inspect output. |
|
The registry preserves a compatibility contract. |
Current normal pyfcstm paths should emit it. |
This split keeps CI filters honest. A filter can decide to fail on all
error diagnostics, fail on target-relevant warnings, and merely record infos;
it can also decide not to expect verify-only codes in a default static report.
Why diagnostics help LLM repair loops
An LLM prompt that contains only prose has to guess the edit target. An inspect LLM report gives it a safer packet:
a stable
codethat selects a known repair strategy;a
severitythat helps prioritize;a precise
locationand source excerpt when source text is available;refsthat carry the state, variable, event, guard, target profile, or provenance object;registry
recommended_actionsanddo_notrules;a global repair protocol that asks for the smallest source edit.
The packet is guidance, not permission for broad rewrites. If two diagnostics point to the same line, the repair loop should inspect provenance first and avoid stacking every suggested action mechanically.
Counterexamples and limits
These examples are intentionally negative. They keep the boundary between inspect, verify, generated code, and repair tooling clear.
Counterexample |
Correct interpretation |
|---|---|
Invalid DSL file |
A missing brace exits with |
Duplicate state name |
Model validation exits with |
C-family numeric warning |
It can be a real C/C++ deployment risk while remaining non-applicable to Python generated runtimes. |
|
The static data-flow analyzer found no DSL write path. It did not prove an abstract handler will never mutate external state. |
|
The command can add bounded topology or bounded SMT findings. It does not silently enable BMC search or unbounded path exploration. |
LLM repair report |
The report makes a repair prompt more grounded. It does not prove that the LLM’s patch is correct without tests or human review. |
Operational boundary summary
Use this matrix when deciding where to handle an outcome.
Outcome |
Where it appears |
Owner |
First response |
|---|---|---|---|
Missing input file |
stderr and exit status |
CLI wrapper or calling process |
Fix path or working directory. |
Parse or model error |
stderr and exit status |
DSL author or importer |
Fix source before expecting a report. |
Static warning |
|
Model author or reviewer |
Inspect |
Verify policy rejection |
stderr and exit status |
CI or command author |
Use allowed policy or a separate explicit verification workflow. |
Target warning |
|
Deployment owner |
Decide relevance by generated target family. |
LLM repair guidance |
|
Repair loop and reviewer |
Apply smallest justified edit and verify afterwards. |
A good inspect workflow therefore has two gates: first prove the command produced a report, then decide what its diagnostics mean for the consumer.
Practical reading order
Read each diagnostic in order: code for category, severity for
priority, span or location for source, then refs for target,
variable, event, or provenance scope. Read prose last so you do not act without
target scope or author intent.
If a diagnostic has no source range, do not treat that as a tool defect first. Check whether it comes from a lookup API, compatibility contract, generated object, or no safe single source object; the code reference lists source object and refs.
The same order is useful when reviewing an LLM patch: if it cannot name the
code, source range, and refs field it used, it has not followed the
report. In short: prove the report exists, decide whether the item applies to
the current target, then edit source; this page explains reading behavior
instead of repeating reference tables.